Earn the average
August 13, 2019
We’ve heard them all before. The cliche investment phrases. They sound like this:
- “Stay the course”
- “Over the long term, …”
- “It’s not timing the market, it’s time in the market.”
- “The only way you get hurt on a roller coaster is if you jump off.”
- “It’s important to keep a long term perspective.”
- “If there wasn’t any risk, there wouldn’t be any reward for being invested in stocks.”
Those were really easy for me to write because I’ve used them all before. Sometimes I feel like a broken record when I’m talking with a client because I’m sure they’re probably sick of me saying these phrases (or they’re sick of hearing them from other sources).
However, I’ve learned that it’s not as common as I think for clients and anyone else outside of the investment landscape. Why? Because it’s boring. It doesn’t turn heads. It doesn’t generate clicks. It doesn’t sell newspapers (they still sell those, right?). A long term investment philosophy is boring, and that’s the way that it should be. The US stock market has delivered an average annual return of around 10% since 1926. But we know that short-term results can vary and past performance is no guarantee of future results, and in any given period stock returns can be positive, negative, or flat. When setting expectations, it’s helpful to see the range of outcomes experienced by investors historically. One piece of data that always fascinates me is the relationship between the yearly returns of the market compared to the long term average.

Start Planning Today
Don’t miss out on exclusive access to financial tips, strategies, and expert-led webinars. Subscribe to the “Planning Life, On Purpose” newsletter today and stay ahead of the planning curve!
Exhibit 1 shows calendar year returns for the S&P 500 Index since 1926. The shaded band marks the historical average of 10%, +/- 2 percentage points. The S&P 500 Index had a return within this range in only six of the past 93 calendar years. In most years, the index’s return was outside of the range—often above or below by a wide margin—with no obvious pattern or predictability for what was to come the following year. For investors, the data highlight the importance of looking beyond average returns and being aware of the range of potential outcomes.
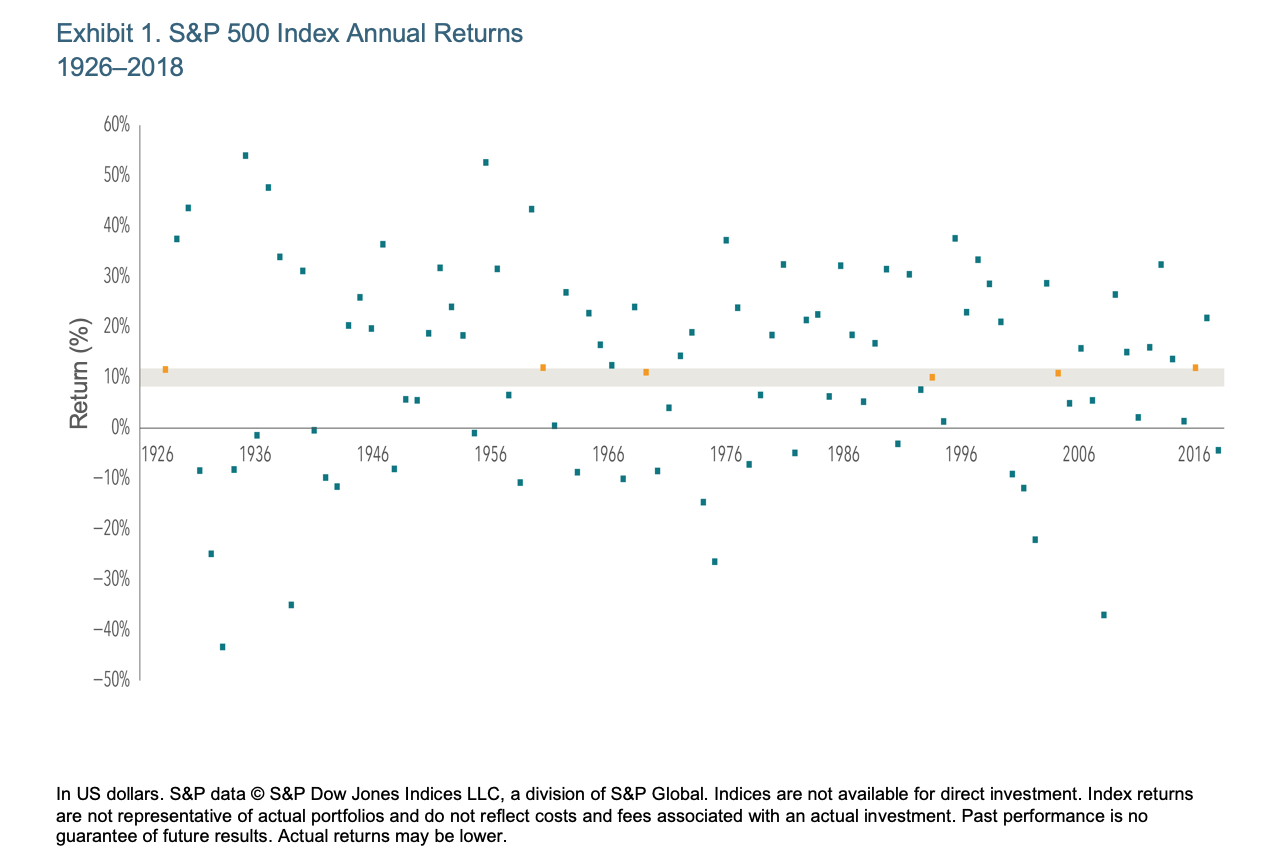
My biggest takeaway from this graph is that in order to earn the average, we “must be present to win” and stay the course over the long haul (cure cliche investing quote <<yawn>> and <<eyeroll>>).
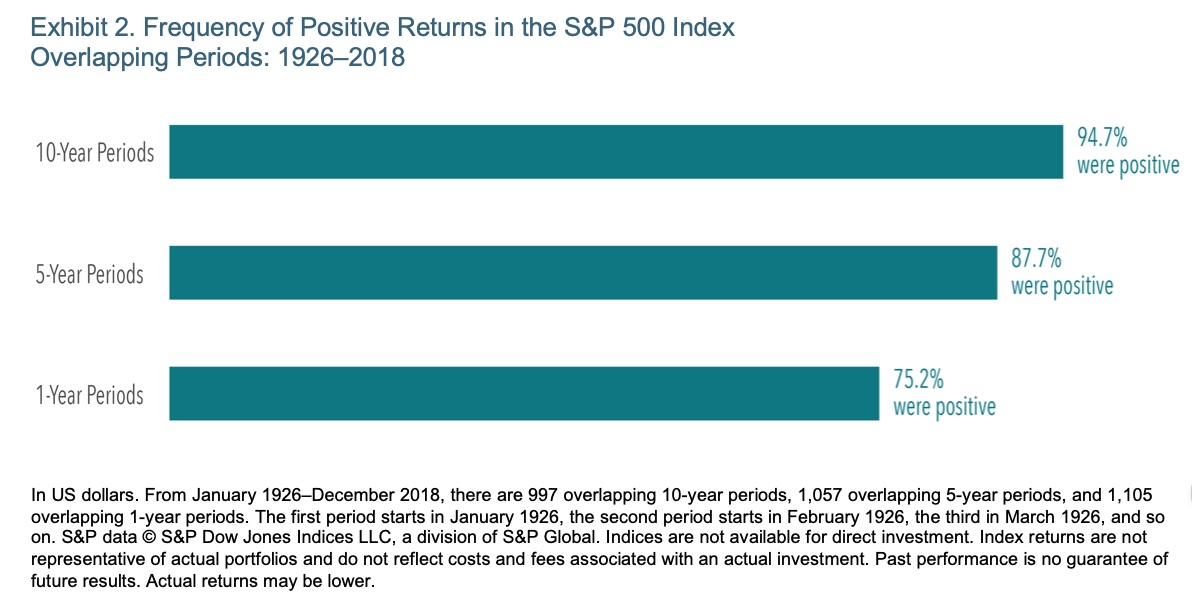
Despite the year-to-year volatility, investors can potentially increase their chances of having a positive outcome by maintaining a long-term focus (cue another boring <<yawn>> and <<eyeroll>>). Exhibit 2 documents the historical frequency of positive returns over rolling periods of one, five, and 10 years in the US market. The data show that, while positive performance is never assured, investors’ odds improve over longer time horizons.
While some investors might find it easy to stay the course in years with above-average returns, periods of disappointing results may test an investor’s faith in equity markets. Being aware of the range of potential outcomes can help investors remain disciplined, which in the long term can increase the odds of a successful investment experience. What can help investors endure the ups and downs? While there is no silver bullet, understanding how markets work and trusting market prices are good starting points. An asset allocation that aligns with personal risk tolerances and investment goals is paramount. Investing without a plan is akin to setting out on a road trip without a map–you have no frame of reference, no baseline and target to aim for, and lacking a set of principles to guide you.
Having a good, goals-based investment policy is like rumble strips on the side of the road. We rarely need them when things are going good and investment accounts are tracking “up and to the right.” But if we start drifting away from the lane, those rumble strips are a good reminder to keep us within the pre-determined asset allocation by having a good set of “guardrails” around your portfolio and provide perspective. Part of our process is helping our clients understand what their rumble strips are for their portfolio. If you’re wondering what yours should look like, feel free to take our free assessment and we’d be happy to discuss the results with you to help provide confidence that your investment portfolio is aligned with your risk tolerance and long-term goals.
Share